Labour market statistics for disabled people - June 2024 quarter
We look at new labour market data from Stats NZ to see what it means for disabled people.
Since 2017, Stats NZ has included the Washington Group Short Set external URL (WGSS) questions on functioning in June quarters of the Household Labour Force Survey (HLFS). The WGSS questions are not designed to produce comprehensive counts or rates of disabled people. Instead, disability status derived from the WGSS questions is used to compare a broad range of labour market outcomes for disabled and non-disabled people and estimate differences in the characteristics of disabled and non-disabled populations.
Disabled people are identified as those who have a lot of difficulty, or cannot do at all, at least one of the following six activities: seeing (even with their glasses), hearing (even with their hearing aid), walking or climbing stairs, remembering or concentrating, self-care, and communicating.
Disability status is strongly correlated with age, which means older people are disproportionately represented in disability data. People aged 65 years and over are also less likely to participate in the labour market, and often have quite different outcomes to younger people. To reduce the impact of this age bias, the data reported here is restricted to the population aged 15 to 64 years of age.
Further data for 15- to 64-year-olds and for all people aged 15 years and over can be downloaded in a spreadsheet here:
More information can be found on the Stats NZ website page:
Labour market summary
For disabled people aged 15 to 64 years, in the June 2024 quarter:
- The labour force participation rate was 44.7 percent, compared with 84.1 percent for non-disabled people, a participation gap of 39.4 percentage points. There has been no significant change in the labour force participation rate for disabled people since the series began in 2017.
- The employment rate was similar to the June 2023 quarter at 39.8 percent, compared with 80.3 percent for non-disabled people. The disability employment gap, the difference between employment rates for disabled and non-disabled people, is a key measure of how disabled people are faring in the workforce. In the June 2024 quarter, the disability employment gap was 40.5 percentage points. There has been no significant change in this gap when compared with 2017, when the series began.
- The unemployment rate was 11.0 percent, more than double the rate for non-disabled people (4.5 percent).
- Median weekly income from all sources was $523 for disabled people, less than half the income for non-disabled people ($1,141).
Labour market activity by disability status
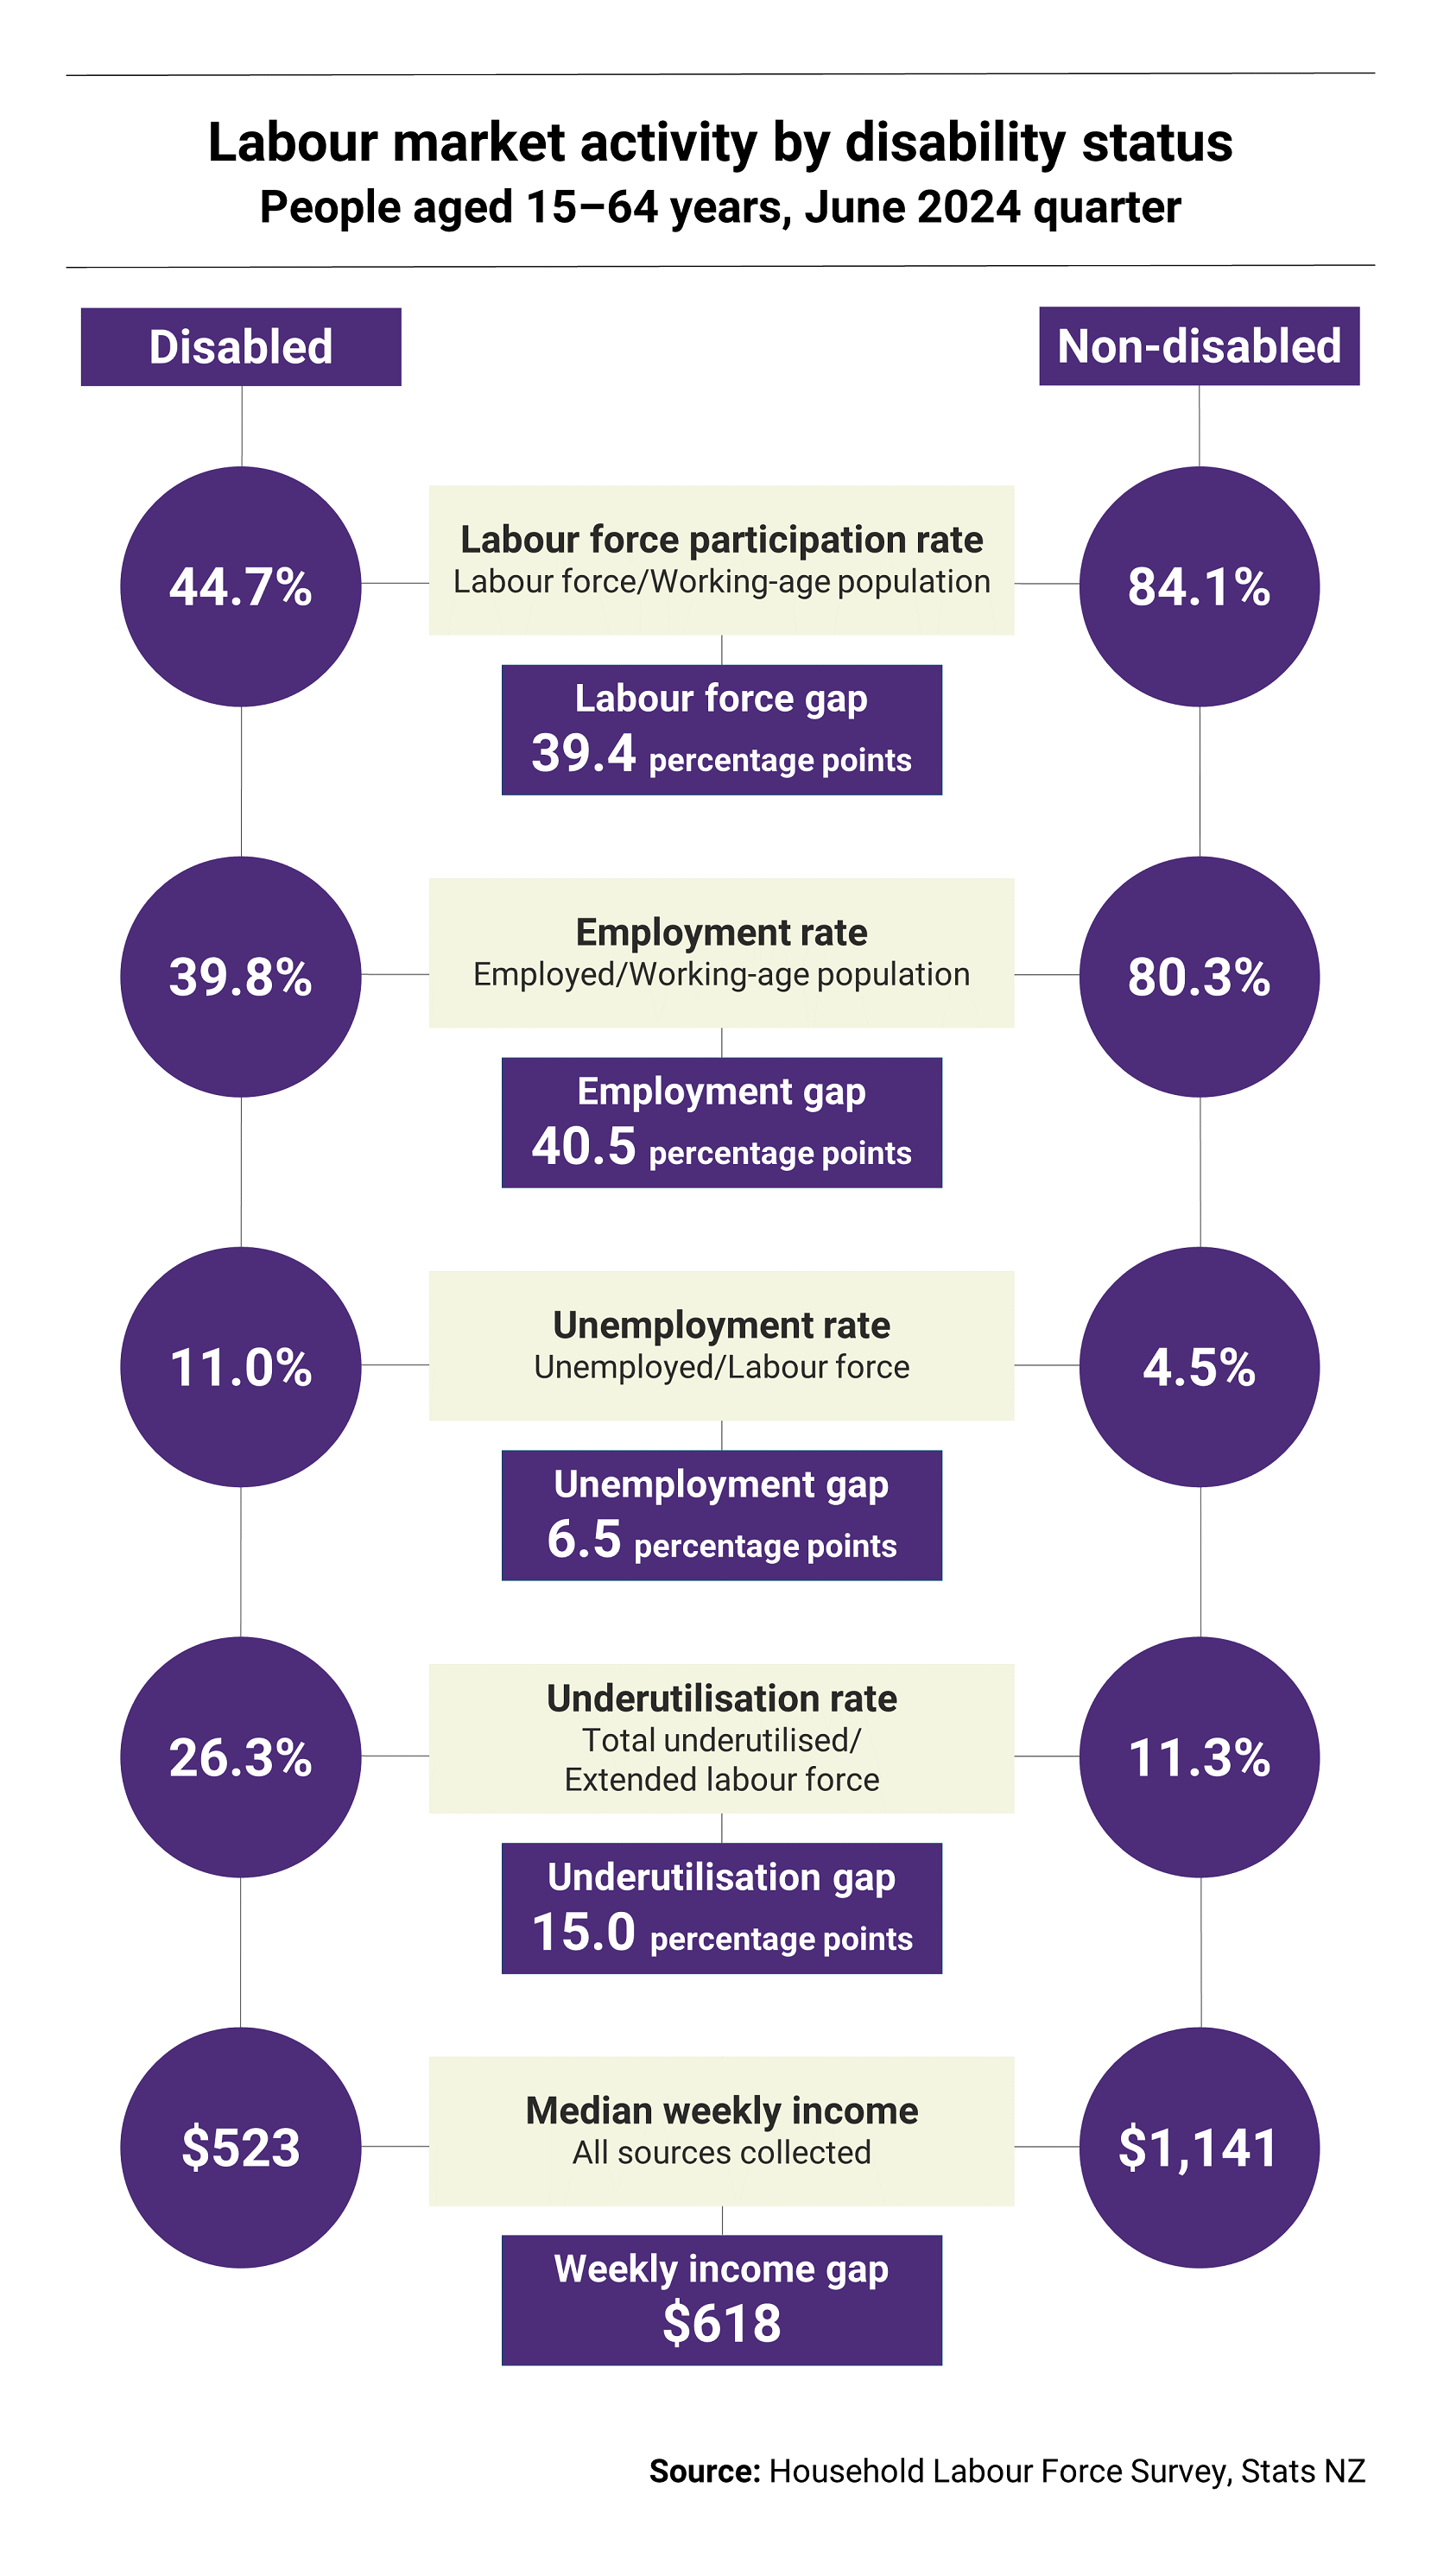
Labour force participation rate is labour force divided by working-age population: 44.7% disabled and 84.1% non-disabled. The labour force gap is 39.4 percentage points.
Employment rate is employed divided by working-age population: 39.8% disabled and 80.3% non-disabled. The employment gap is 40.5 percentage points.
Unemployment rate is unemployed divided by labour force: 11.0% disabled and 4.5% non-disabled. The unemployment gap is 6.5 percentage points.
Underutilisation rate is total underutilised divided by extended labour force: 26.3% disabled and 11.3% non-disabled. The underutilisation gap is 15.0 percentage points.
Median weekly income from all sources collected: $523 disabled and $1,141 non-disabled. Weekly income gap is $618.
Labour market participation lower for tāngata whaikaha Māori
For tāngata whaikaha Māori aged 15 to 64 years:
- the labour force participation rate was 34.6 percent, compared with 78.1 percent for non-disabled Māori
- the employment rate was 27.2 percent, compared 71.2 percent for non-disabled Māori. The disability employment gap for tāngata whaikaha Māori was 44 percentage points.
Employment rates similar for disabled men and women
Employment rates for disabled men and women were similar (39.1 percent and 40.3 percent, respectively) but the disability employment gap (the difference in employment rates between disabled and non-disabled people) was smaller for women (36.5 percentage points) than men (44.7 percentage points).
Disabled people less likely to work full time
For disabled people in employment:
- Two-thirds (66.8 percent) worked full time, compared with 82.2 percent of non-disabled people.
- They were less likely to be a paid employee (76.9 percent compared with 83.4 percent) and more likely to be self-employed (without employees, 16.3 percent compared with 10.7 percent) than non-disabled people.
- Higher rates of self-employment may be linked to the most common occupations for disabled people including managers. Around a quarter (25.7 percent) of employed disabled people were managers, a group which includes those whose main activity is 'business owner' or 'CEO'. Other common occupations include professionals (18.2 percent), and labourers (12.1 percent).
- 28.0 percent had been in the same job for 10 years or more, compared with 20.6 percent of non-disabled people.
Over a quarter of disabled people underutilised in the labour market
Underutilisation gives a broader measure of unused capacity in the labour market.
It includes people who are:
- unemployed - do not have a job, but are available and actively looking for work
- underemployed - employed part time (fewer than 30 hours a week) and who want and are available to work more hours
- an available potential job seeker – available and want to work, but not currently looking for a job
- an unavailable jobseeker – unavailable to start work now but looking for work and will be available in the next month.
Available potential jobseekers and unavailable jobseekers make up the potential labour force, which can be combined with the labour force (employed and unemployed people) to create the extended labour force.
The underutilisation rate is the proportion of people who are underutilised out of the total extended labour force, whilst the underemployment rate is the percentage of people who are underemployed out of all employed people.
In the June 2024 quarter, disabled people aged 15 to 64 years were:
- more than twice as likely as non-disabled people to be underutilised (underutilisation rates of 26.3 percent and 11.3 percent, respectively)
- almost twice as likely to be underemployed (underemployment rates of 8.1 percent and 4.2 percent, respectively).
Young disabled people less likely to be earning or learning
Disabled young people aged 15 to 24 years were much less likely to be earning or learning than non-disabled young people. The NEET (Not in Employment, Education or Training) rate for disabled young people was 46.3 percent, more than four times the NEET rate for non-disabled young people (11.0 percent).
More disabled people with postgraduate qualifications
In the June 2024 quarter:
- Almost a third (32.7 percent) of disabled people aged 15 to 64 years had no qualification, compared with 13.1 percent of non-disabled people in the same age group.
- Disabled people were also much less likely to hold a bachelor’s degree or higher than non-disabled people (15.0 percent and 35.0 percent, respectively). However, there was a significant increase in the proportion of disabled people with a postgraduate qualification or higher, from 2.8 percent in 2023 to 6.1 percent in 2024. Due to the small size of this group, however, care should be taken when interpreting these results.
Self-care the most common main activity for non-working disabled people
The most common main activity for disabled people (aged 15 to 64 years) not in the labour force was own care due to sickness/injury/disability (39.9 percent) followed by free-time activities (23.1 percent). This compares with 7.5 percent and 15.6 percent, respectively, for non-disabled people.
Disabled people were much less likely than non-disabled people to identify their main activity as study or training (5.5 percent, compared with 36.5 percent), or looking after a child (12.4 percent, compared with 20.8 percent).
Disabled people more likely to leave employment due to sickness, illness or injury
Almost two thirds (63.8 percent) of disabled people aged 15-64 who were unemployed or not in the labour force, but had a job within the last 5 years, said their main reason for leaving was their own sickness, illness or injury. For non-disabled people this was 14.4 percent.
Disability pay gap at 7.6 percent
The Household Labour Force Survey also includes additional income questions in June quarters. This provides information about individual and household income, including wages and salaries, self-employment, and government transfers income.
Further information about the 2024 June quarter income release can be found on the Stats NZ website external URL .
For disabled people aged 15 to 64 years:
- The median weekly income from all sources was $523 in 2024, compared with $474 in 2023. For non-disabled people, median weekly income from all sources rose from $1,089 in 2023 to $1,141 in 2024.
- Median weekly income from wages and salaries was $1,155, compared with $1,343 for non-disabled people. Some of this difference is likely due to disabled people being more likely to work part-time, and working, on average, fewer hours than non-disabled people, whilst some is due to lower median hourly wages.
- Median hourly wages and salaries in the June 2024 quarter was $31.00, compared with $33.56 for non-disabled people, in 2023 these numbers were $28.00 and $31.83, respectively.
In line with the approach taken by Stats NZ to calculating the gender pay gap, we have calculated the disability pay gap as the proportional difference in median hourly earnings between non-disabled and disabled people. In the June 2024 quarter, the disability pay gap was 7.6 percent, compared with 12.0 percent in 2023.