
Labour market statistics for disabled people: June 2026 quarter
Stats NZ’s 'Labour market statistics: June 2026 quarter' provides a picture of the New Zealand labour market, including official employment, unemployment, labour force participation and underutilisation rates.
It uses data from the Household Labour Force Survey (HLFS), which has included the Washington Group Short Set of questions on functioning in June quarters since 2017.
We have summarised some of the key findings for disabled people (compared with non-disabled people) from the latest data.
For more information, you can:
- read Stats NZ’s Labour market statistics: June 2026 quarter external URL
- read about the Washington Group Short Set questions
- download further data on labour market outcomes for disabled people (XLSX 632KB)
Labour market summary
In the June 2026 quarter, labour market outcomes continued to differ significantly between disabled and non-disabled people across all main measures.
When compared with non-disabled people aged 15 to 64 years, disabled people aged 15 to 64 years had:
- a lower labour force participation rate (41.7% compared with 83.1%) – a labour force participation gap of 41.4 percentage points
- a lower employment rate (36.4% compared with 78.4%) – an employment gap of 42.0 percentage points
- a higher unemployment rate (12.8% compared with 5.7%) – an unemployment gap of 7.1 percentage points
- a higher underutilisation rate (30.0% compared with 13.6%) – an underutilisation gap of 16.4 percentage points.
The rates for disabled people have not changed significantly since 2025, or since the series began in 2017.
Labour market activity by disability status
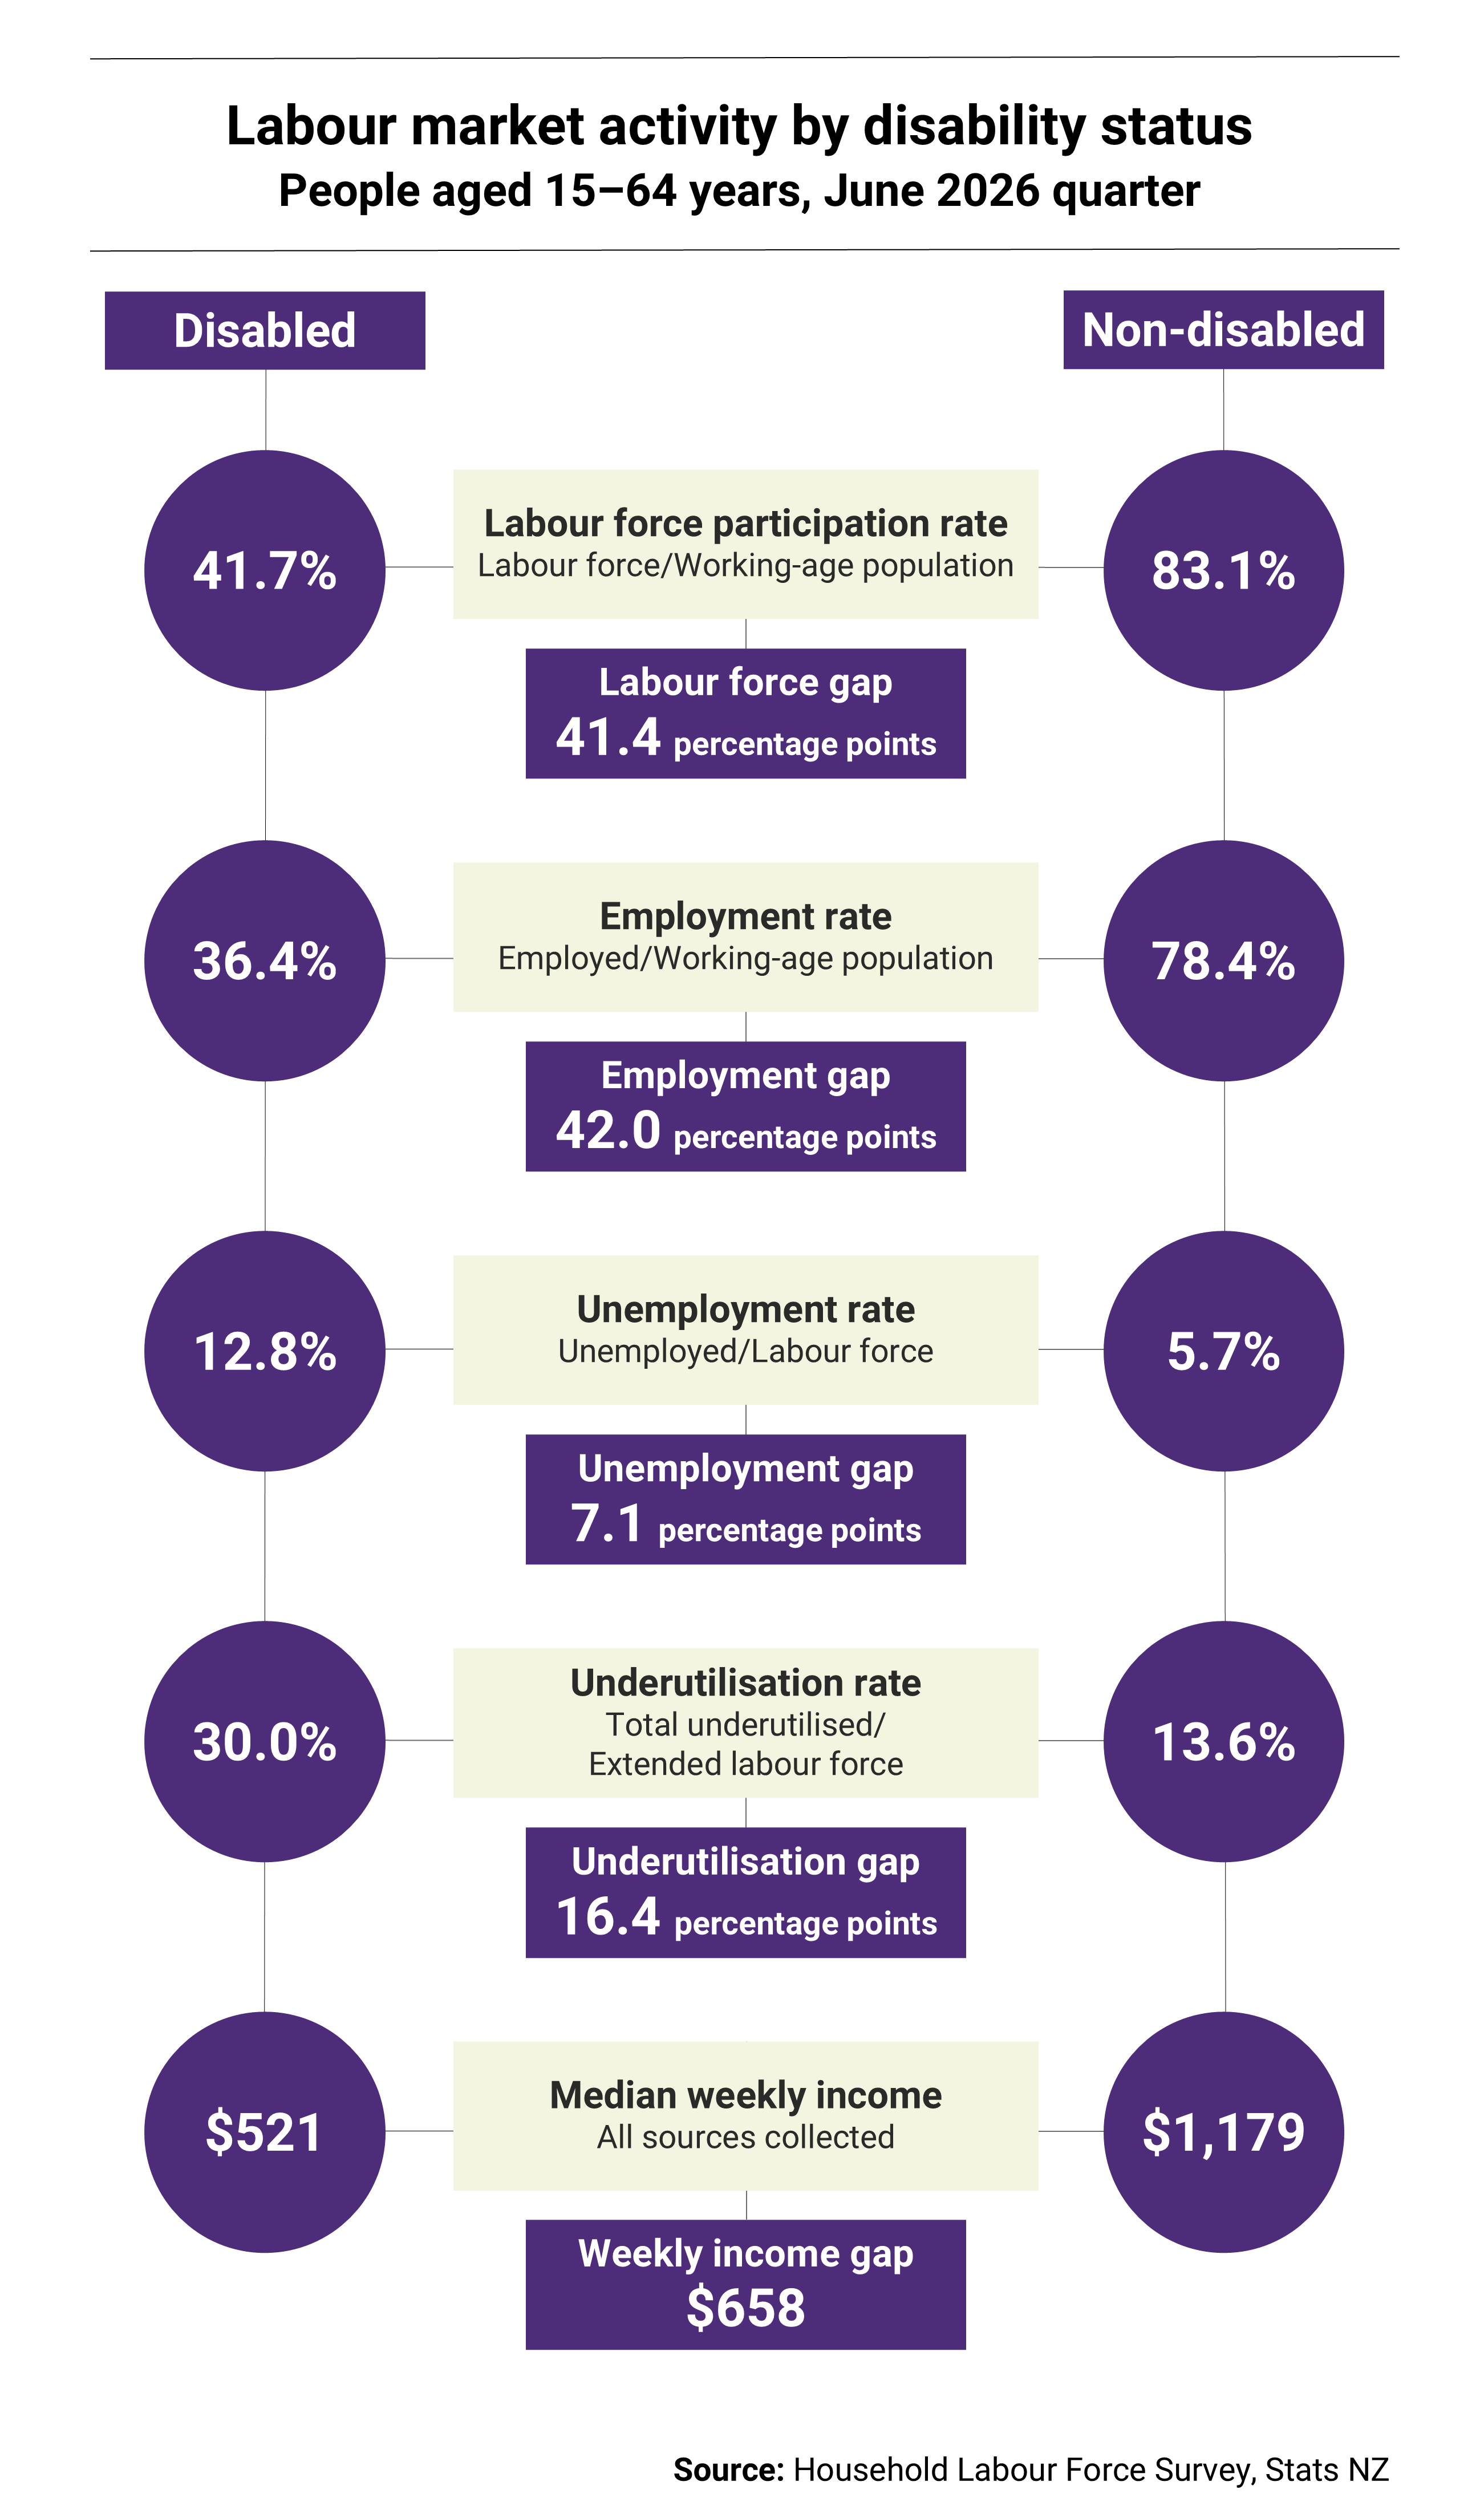
Labour force participation rate is labour force divided by working-age population: 41.7% disabled and 83.1% non-disabled. The labour force gap is 41.4 percentage points.
Employment rate is employed divided by working-age population: 36.4% disabled and 78.4% non-disabled. The employment gap is 42.0 percentage points.
Unemployment rate is unemployed divided by labour force: 12.8% disabled and 5.7% non-disabled. The unemployment gap is 7.1 percentage points.
Underutilisation rate is total underutilised divided by extended labour force: 30.0% disabled and 13.6% non-disabled. The underutilisation gap is 16.4 percentage points.
Median weekly income from all sources collected: $521 disabled and $1,179 non-disabled. The weekly income gap is $658.
Tāngata whaikaha Māori experience lower employment and participation in the labour force
When compared with non-disabled Māori, tāngata whaikaha Māori aged 15 to 64 years had:
- a lower employment rate (26.8% compared with 67.0%) – a disability employment gap of 40.2 percentage points
- a lower labour force participation rate (33.9% compared with 75.3%) – a labour force participation gap of 41.4 percentage points.
The difference in unemployment rates for tāngata whaikaha Māori and non-disabled Māori (20.9% and 11.0% respectively) was not statistically significant. More detail on the survey analysis methodology and statistical significance is set out in About the data.
Employment gaps for disabled men and women
The data shows large gaps in employment and labour force participation rates for both disabled men and disabled women.
For people aged 15 to 64 years, the disability employment gap for women was 38.6 percentage points, compared with 45.5 percentage points for men. However, there was no significant difference between the employment rates for disabled men and disabled women.
When compared with non-disabled men, disabled men had:
- a lower employment rate (35.8% compared with 81.3%)
- a lower labour force participation rate (43.1% compared with 86.2%)
- a higher unemployment rate (17.0% compared with 5.6%).
When compared with non-disabled women, disabled women had:
- a lower employment rate (36.9% compared with 75.5%)
- a lower labour force participation rate (40.4% compared with 80.0%).
The difference in unemployment rates for disabled and non-disabled women (8.7% and 5.7% respectively) was not statistically significant.
Underutilisation higher for disabled people
Underutilisation is a broader measure of unmet demand for work. It includes:
- people who are unemployed
- people who are employed part-time but want and are available to work more hours (underemployed)
- the potential labour force.
The potential labour force includes:
- available potential jobseekers, who want and are available to work but are not actively seeking a job, and
- unavailable jobseekers, who are actively seeking work but are not currently available to start, but will be in the next month.
When compared with non-disabled people aged 15 to 64 years, disabled people aged 15 to 64 years were:
- more than twice as likely to be underutilised (30.0% compared with 13.6%)
- almost twice as likely to be underemployed (10.2% compared with 5.2%).
Employed disabled people more likely to work part-time and have long job tenure
Among employed adults (aged 15 and over):
- disabled adults were less likely to work full-time (61.0% compared with 79.8%)
- disabled adults usually worked fewer weekly hours on average (31.6 hours compared with 36.9 hours) than non-disabled adults.
There were no significant differences between employed disabled and non-disabled adults across most job tenure groups. However, employed disabled adults were significantly more likely to have been in their current job for 10 years or more (32.6% compared with 24.4%).
Employed disabled adults less likely to be paid employees
Most employed adults (aged 15 years and over) were paid employees, regardless of disability status. However, when compared with employed non-disabled adults, employed disabled adults were:
- less likely to be a paid employee (69.7% compared with 81.8%)
- more likely to be self-employed (without employees) (18.0% compared with 12.1%)
- more likely to work as an unpaid family worker (4.4% compared with 0.7%).
There was no statistically significant difference in the proportions of employed disabled and non-disabled people who were employers (8.0% and 5.5%, respectively).
Disabled adults more likely to work in agriculture and the arts
The data shows differences in the industries and occupations disabled and non-disabled adults (aged 15 years and over) work in.
When compared with employed non-disabled adults, employed disabled adults were:
- more likely to work in agriculture, forestry, fishing, and mining (10.3% compared with 6.0%)
- more likely to work in the arts, recreation, and other services (12.6% compared with 6.8%)
- less likely to be employed as a professional (18.9% compared with 25.5%).
The proportion of employed disabled adults working as labourers has declined since the series began in 2017. In 2017, 16.2% of employed disabled adults worked as labourers, significantly higher than the rate for employed non-disabled adults (10.0%). In 2026, there was no significant difference in the proportions of disabled and non-disabled people working as labourers (9.6% and 8.3%, respectively).
Many disabled young people not earning or learning
Disabled young people aged 15 to 24 years were much less likely to be working or studying than non-disabled young people. The NEET (Not in Employment, Education, or Training) rate for disabled young people was 41.7% compared with 12.2% for non-disabled young people.
When compared with non-disabled young people, disabled young people were:
- less likely to be participating in the labour force (40.4% compared with 63.6%)
- less likely to be employed (29.3% compared with 52.7%).
Disabled adults less likely to have higher qualifications
The survey collects information on the highest qualification respondents had achieved. When compared with non-disabled adults aged 15 to 64 years, disabled adults aged 15 to 64 years were:
- less likely to hold a postgraduate qualification or higher (5.0% compared with 11.8%)
- less likely to hold a bachelor’s degree as their highest qualification (9.3% compared with 22.7%)
- more likely to have no qualification (33.9% compared with 13.3%).
There is no significant difference in the proportions of disabled and non-disabled adults whose highest qualification is a school qualification, a level 1–3 post-school qualification, or a level 4+ qualification.
Own care is the main activity of disabled people not in the labour force
Among disabled people aged 15 to 64 years who were not in the labour force, the most common main activity was their own care due to sickness, injury, or disability (40.5%). This was significantly higher than for non-disabled people (8.5%).
Free-time activities were also more common for disabled people not in the labour force, (20.8% compared with 15.0% for non-disabled people not in the labour force). In contrast, disabled people were less likely to say their main activity was study or training (8.9% compared with 37.6%) or looking after a child (9.8% compared with 20.3%).
Sickness, illness, or injury a common reason for leaving a job
For those aged 15 to 64 years, disabled people were more likely than non-disabled people to report their own sickness, illness, or injury as the main reason for leaving their last job (56.8% compared with 14.1%).
When compared with non-disabled people, disabled people were less likely to report leaving their last job mainly because of:
- parental or family responsibilities (10.4% compared with 20.0%)
- the end of a temporary, seasonal, or contract job (8.4% compared with 15.3%)
- enrolling in education or training (4.6% compared with 13.8%)
- dissatisfaction with the job or working conditions (3.5% compared with 8.0%).
Hourly disability pay gap at 7.4%
The Household Labour Force Survey includes additional income questions in the June quarter. These provide information about individual and household income, including income from wages and salaries, self-employment, and government transfers.
For further information, read Stats NZ’s Labour market statistics (income): June 2026 quarter external URL .
For disabled people aged 15 to 64 years:
- Median weekly income from all sources was $521, compared with $1,179 for non-disabled people.
- Median hourly wages and salaries were $33.31, compared with $35.96 for non-disabled people, an hourly disability pay gap of 7.4%.
- Median weekly income from wages and salaries was $1,200, unchanged from 2025. For non-disabled people this was $1,438, a weekly disability pay gap of 16.6%. The larger weekly than hourly pay gap is consistent with disabled people being more likely to work part-time and working fewer hours on average.
About the data
Sampling
The Household Labour Force Survey is based on a sample of households across New Zealand. Around 15,000 households take part every 3 months, and everyone aged 15 years and over living in a selected household is included. Households remain in the survey for 2 years and are interviewed every quarter.
Because the results are estimates based on a sample rather than the whole population, they are subject to sampling error. This summary reports differences between disabled and non-disabled people only where the difference is statistically significant (the absolute sampling errors do not overlap). Because of the small size of some groups of interest, sample errors can be large. This means that in some cases even quite large differences between disabled and non-disabled people may not be statistically significant.
Disability status
Disability status is identified using the Washington Group Short Set of questions on functioning. These questions identify disabled people as those who have a lot of difficulty, or cannot do at all, at least 1 of 6 activities:
- seeing, even when wearing glasses
- hearing, even when using a hearing aid
- walking or climbing stairs
- remembering or concentrating
- self-care
- communicating.
The questions are not designed to provide a comprehensive count of all disabled people. Instead, disability status derived from the questions is used to compare labour market and income outcomes for disabled and non-disabled people.
Age ranges
Disability is strongly related to age, meaning older people make up a larger proportion of the disabled population. People aged 65 years and over are also less likely to participate in the labour market and may have different labour market outcomes from younger people.
For this reason, estimates in this summary generally relate to people aged 15 to 64 years. This reduces the effect that the older age profile of the disabled population may have on comparisons between disabled and non-disabled people.
Estimates for measures relating specifically to employed people include employed adults aged 15 years and over. This is because these measures describe the characteristics and experiences of people who are already employed, rather than their likelihood of participating in the labour market. These measures include:
- working arrangements
- hours worked
- employment status
- industry
- occupation
- job tenure.
The age range used is stated in each section where needed. Additional estimates for people aged 15 to 64 and all people aged 15 years and over are available in the downloadable data.